Specify rendering options for CAD files Leave feedback
On this page
GroupDocs.Viewer ships with the CadOptions class that allows you to specify different options for rendering CAD files. To access these options, use the CadOptions property for one of the following classes (depending on the output file format):
Use the cad_options.background_color property to specify the background color for the output file.
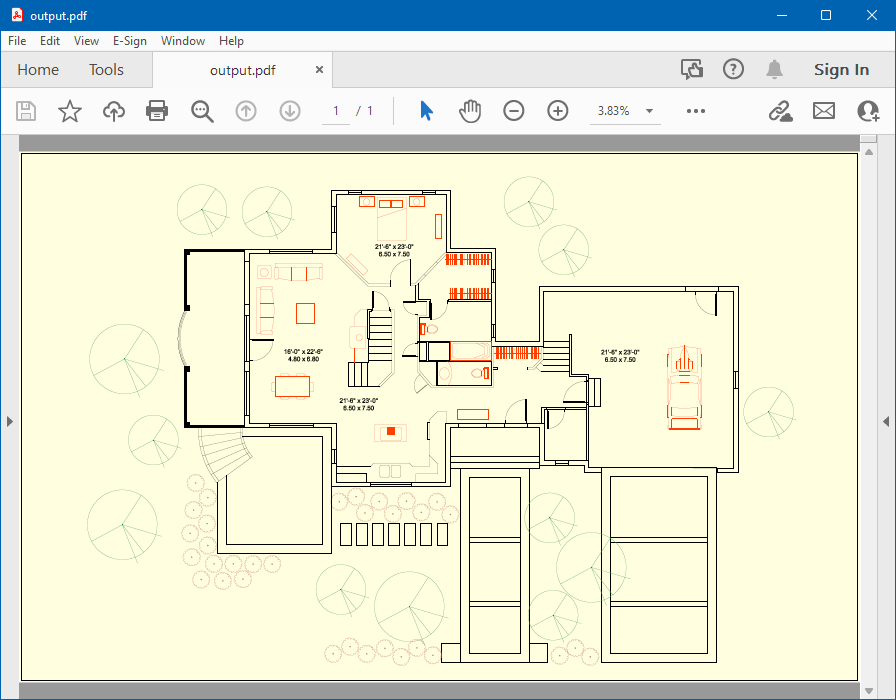
The following code snippet converts a CAD drawing to PDF and sets the background color of PDF pages to light yellow:
from groupdocs.viewer import Viewer
from groupdocs.viewer.options import PdfViewOptions
from groupdocs.viewer.drawing import Argb32Color

def set_background_color():
    # Load CAD file
    with Viewer("sample.dwg") as viewer:
        viewOptions = PdfViewOptions("set_background_color/background_color.pdf")
        viewOptions.cad_options.background_color = Argb32Color.from_rgb(255, 255, 0)  # RGB color for yellow
        viewer.view(viewOptions)

if __name__ == "__main__":
    set_background_color()
sample.dwg is the sample file used in this example. Click here to download it.
The following image illustrates the result:
When rendering a CAD drawing, GroupDocs.Viewer creates an image with the largest dimension (width or height) set to 2000 pixels. The other dimension is calculated based on the aspect ratio of the original drawing. You can use the following methods to change the width and height of the output file:
- CadOptions.for_rendering_by_width—Specifies the output image width in pixels. The image height is calculated based on the aspect ratio of the original CAD drawing.
- CadOptions.for_rendering_by_height—Specifies the output image height in pixels. The image width is calculated based on the aspect ratio of the original CAD drawing.
- CadOptions.for_rendering_by_width_and_height—Specifies the output image width and height in pixels.
- CadOptions.for_rendering_by_scale_factor—Specifies a scale factor to apply to the output image. Values between 0 and 1 decrease the image size, and values greater than 1 increase the image.
The following example converts a CAD drawing to PNG format and reduces the width and height of the output image by 50%:
from groupdocs.viewer import Viewer
from groupdocs.viewer.options import PngViewOptions, CadOptions

def set_image_size():
    # Load CAD file
    with Viewer("sample.dwg") as viewer:
        # Convert the diagram to PNG.
        png_options = PngViewOptions("set_image_size/image_with_size_limits.pdf")
        # Specify a scale factor.
        png_options.cad_options = CadOptions.for_rendering_by_scale_factor(0.5)
        viewer.view(png_options)

if __name__ == "__main__":
    set_image_size()
sample.dwg is the sample file used in this example. Click here to download it.
When you render all layouts/sheets contained in a CAD file (the CadOptions.render_layouts property is True), each layout/sheet is rendered as a separate page/image and has its own size. In this case, when you specify only the width or height value, the other side is scaled proportionally to maintain the aspect ratio of each layout/sheet. When you set both width and height, all generated images have the same size and may look distorted. To avoid this, use the CadOptions.layout_name property to render each layout/sheet separately and set its size.
AutoCAD allows you to configure plotter settings and save them as a PC3 file (Plotter Configuration Version 3) for later use. With GroupDocs.Viewer, you can apply width and height values from a PC3 file to the output file when you convert your CAD drawing to HTML, PDF, or image format. Use the CadOptions.pc_3_file property for a target view to specify a path to the PC3 file with required settings. The default location for PC3 files is “C:\Users\[Username]\AppData\Roaming\Autodesk\AutoCAD [Version]\[Version Code]\[Language]\Plotters”.
from groupdocs.viewer import Viewer
from groupdocs.viewer.options import PdfViewOptions

def apply_pc3_file():
    # Load CAD file
    with Viewer("sample.dwg") as viewer:
        # Convert the diagram to PDF.
        viewOptions = PdfViewOptions("apply_pc3_file/apply_pc3_file.pdf")
        # Specify a path to the PC3 file.
        viewOptions.cad_options.pc_3_file = "small_page.pc3"
        viewer.view(viewOptions)

if __name__ == "__main__":
    apply_pc3_file()
sample.dwg is the sample file used in this example. Click here to download it.
small_page.pc3 is the PC3 configuration file used in this example. Click here to download it.
With GroupDocs.Viewer, you can split a CAD drawing (in DWG or DWT format) into parts (tiles) and render each part separately. Tiled rendering allows you to reduce memory usage when you convert large drawings to HTML, PDF, or image format. When tiled rendering is enabled, GroupDocs.Viewer renders only the model space layout (Model) and ignores the CadOptions.render_layouts and CadOptions.layout_name property values.
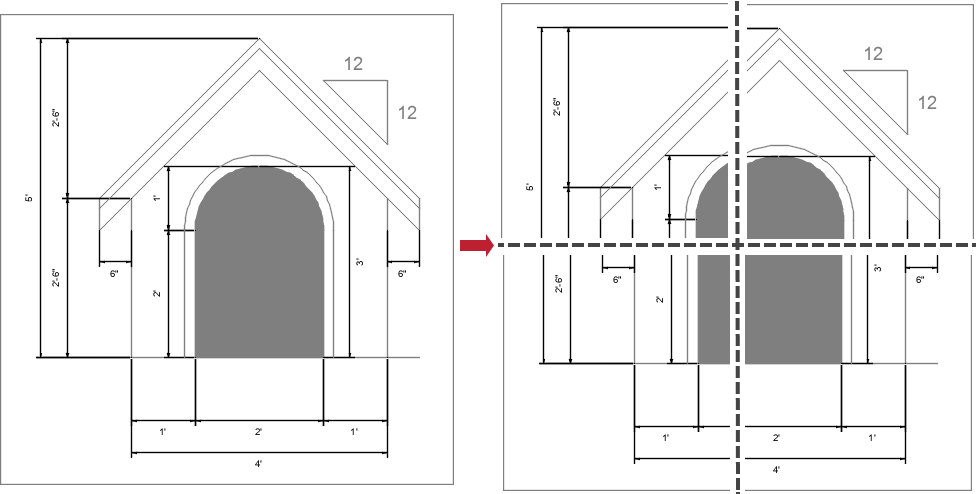
To create an individual tile, instantiate a Tile object. Specify the x- and y-coordinates of the tile’s lower-left corner and the tile width and height (in pixels). The image below illustrates a coordinate system used to define the tile position. The origin (0,0) is located in the lower-left corner of the drawing. The positive x-axis extends horizontally to the right, and the positive y-axis is oriented vertically from bottom to top.
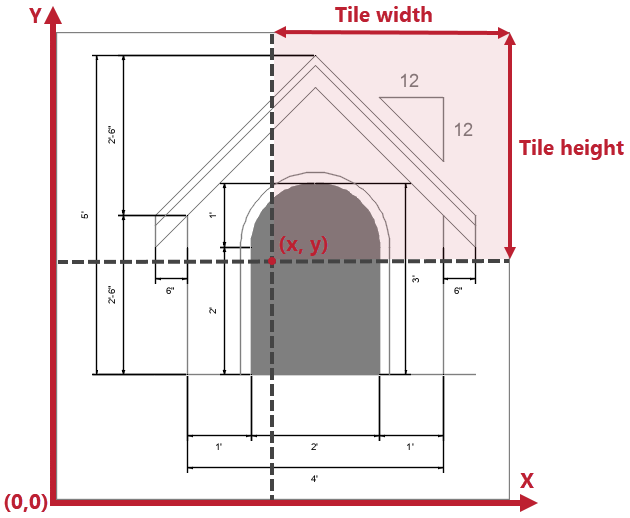
After you create all tiles, add them to the ViewOptions.CadOptions.tiles list and call the Viewer.view method to convert these tiles to a desired format. Each tile will be rendered as a separate page/image.
The following example demonstrates how to split a CAD drawing into four tiles (2x2) of equal size:
from groupdocs.viewer import Viewer
from groupdocs.viewer.options import ViewInfoOptions, HtmlViewOptions, Tile

def split_drawing_into_tiles():
    # Load CAD file
    with Viewer("sample.dwg") as viewer:
        viewInfoOptions = ViewInfoOptions.for_html_view()
        viewInfo = viewer.get_view_info(viewInfoOptions)

        # Get the width and height of the CAD drawing.
        width = viewInfo.pages[0].width
        height = viewInfo.pages[0].height

        # Specify the number of rows and columns to split the drawing into.
        columns = 2
        rows = 2

        # Calculate the width and height of each tile.
        tile_width = width / columns
        tile_height = height / rows
        point_x = 0
        point_y = 0

        # Split the drawing into tiles and convert them to HTML.
        # {0} is replaced with the tile number in the output file name.
        viewOptions = HtmlViewOptions.for_embedded_resources("split_drawing_into_tiles/drawing_into_tiles_{0}.html")
        for i in range(0, columns):
            for j in range(0, rows):
                tile = Tile(point_x + tile_width * i, point_y + tile_height * j, tile_width, tile_height)
                viewOptions.cad_options.tiles.append(tile)
        viewer.view(viewOptions)

if __name__ == "__main__":
    split_drawing_into_tiles()
sample.dwg is the sample file used in this example. Click here to download it.
In the example above the GroupDocs.Viewer will generate four HTML files named “page_1.html”, “page_2.html”, “page_3.html”, and “page_4.html”, where each of these HTML file contains a single tile in a form of SVG vector image. The HtmlViewOptions.for_external_resources() static method (with all its overloads) can also be used — in such case the SVG files will not be embedded inside the output HTML files, but will be saved separately, while HTML only references them through the A HTML element.
Starting from this 24.9 version the CAD tiled rendering is also supported for the PDF — in that case the GroupDocs.Viewer generates a single PDF file, where one its page represents one tile. So, if in the example above we replace the HtmlViewOptions onto the PdfViewOptions, then the GroupDocs.Viewer will produce one PDF file with four pages inside it.
By default the GroupDocs.Viewer converts and renders all documents within CAD format family with the max possible quality. In case when the input CAD file (DWG, for example) is very complex, it may lead to quite significant processing time. Also, the size of the generated output HTML or image (vector or raster) also may be too heavy.
Starting from this version 24.9 the GroupDocs.Viewer introduces a new public property within the CadOptions class — the enable_performance_conversion_mode boolean flag. By default it is set to False - the GroupDocs.Viewer behaves as in previous versions, preserving the maximum quality. But when setting its value to True, then the performance-oriented conversion mode is enabled, which leads to significantly lesser conversion time as well as lesser byte size of the output document.
Enabling this mode is pretty simple — just create an instance of the CadOptions class by using any of the static # described above, and then set the value for the enable_performance_conversion_mode property. Example is below:
from groupdocs.viewer import Viewer
from groupdocs.viewer.options import HtmlViewOptions, CadOptions

def enable_performance_mode():
    # Load CAD file
    with Viewer("input.dwg") as viewer:
        viewOptions = HtmlViewOptions.for_embedded_resources("enable_performance_mode/Output-Page#{0}.html")
        viewOptions.cad_options = CadOptions.for_rendering_by_width(1000)
        viewOptions.cad_options.enable_performance_conversion_mode = True

        viewer.view(viewOptions)

if __name__ == "__main__":
    enable_performance_mode()
input.dwg is the sample file used in this example. Click here to download it.
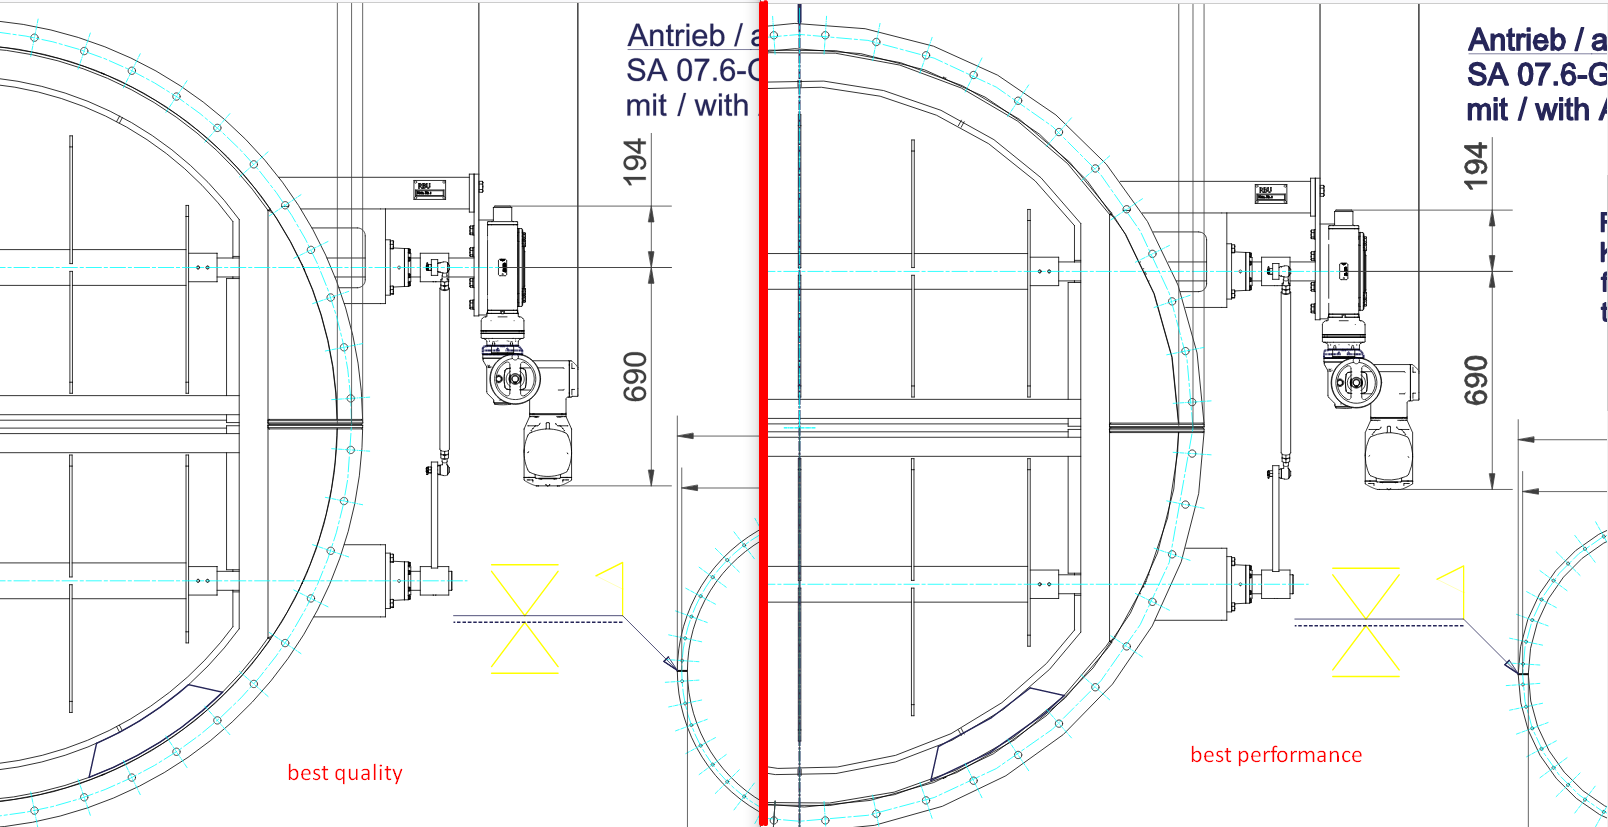
If taking an ordinary DWG file as a sample, the comparison between “quality” and “performance” modes are the next:
| Conversion mode | Output file size, MiB | Processing time, sec | ||
|---|---|---|---|---|
| Quality-oriented (default) | 46.8 | 7.87 | ||
| Performance-oriented (new) | 5.04 | 4.47 |
Screenshot below illustrates the visual differences between these modes, default quality-oriented mode is on the left side, and the new performance-oriented mode is on the right side:
Was this page helpful?
Any additional feedback you'd like to share with us?
Please tell us how we can improve this page.
Thank you for your feedback!
We value your opinion. Your feedback will help us improve our documentation.

